Montealgos · Algorithmic trading firm

Tech driven algos trading.

We are a tech driven firm focused on algorithmic trading strategies. Thanks to a deep software engineering background we build the trading software ourselves, and keep complete control over the process from end to end: research, backtesting, optimization, validation, selection, execution, reporting, automation and artificial intelligence.

See the process Get in touch

  • Strategies live 134
  • Indicators 279+
  • Backtested trades 15 684
  • Validation stages 9

Approach

Trading is a software problem before it is a market problem.

Most trading shops buy their stack and rent their edge. We took the opposite route. Every layer — the historical data store, the candle engine, the indicator library, the strategy builder, the optimizer, the validation pipeline, the portfolio allocator and the exchange executers — is written in house, in TypeScript, and tested like production software.

That control is the edge. When a strategy behaves oddly in production, we can read the exact line of code that produced the signal, replay the exact candles that produced the trade, and reproduce the result bit for bit. Nothing is a black box we cannot open.

  • Mechanical, not discretionary

    Rules are declared as data. The same strategy object drives the backtest, the forward test and the live account, so there is no translation gap between research and money.

  • Robust beats optimal

    We never ship the best parameter set. We ship the one sitting in the widest stable plateau, verified by stability scans, permutations and out of sample windows.

  • Diversification is the risk model

    A hundred small, uncorrelated, low exposure systems across many pairs and timeframes beats one large conviction bet. Exposure is budgeted per symbol and per direction.

  • Automate the whole loop

    Idea generation, optimization, validation, promotion, execution and monitoring run on schedulers. Humans review the dashboards, they do not place the orders.

The pipeline

Nine gates between an idea and an order.

Thousands of candidate strategies enter the research pipeline. Each stage is a filter with a hard rejection rule, and a strategy only reaches a live account after surviving every one of them.

  1. Generation

    An agent composes new strategy candidates from a library of 279 indicators, entry and exit presets, filters and risk templates. Ideas come from research notes, published literature and structured prompting; the output is always a validated strategy object, never free text.

    builderV2builderV3 · MLbuilderV4structured output

  2. Backtest

    Every candidate runs across the full universe — 25 perpetual pairs by 6 timeframes from 2h to 1d — on candles reaching back to 2017, with fees and slippage applied. Anything under 40 trades, a 1.1 profit factor or above 90% time in market is dropped before optimization is allowed to touch it.

    150 symbol × timeframe pairsfees + slippagemulti timeframe

  3. Optimization

    Parameters are optimized in ordered steps — indicator lookbacks first, then filters, then exits and risk — with up to 17 variables per strategy. Grid, chunking and Bayesian optimizers each propose candidates, and the top 100 symbol fits are carried forward.

    gridchunkingbayesianstabilizer

  4. Forward test

    The optimized parameters meet data they have never seen: a strictly out of sample window that starts the day the in sample period ends. Equity and drawdown are resampled weekly and the strategy is rejected on the spot if the window closes below the threshold.

    out of sampleweekly equityhard rejection

  5. Live test

    A second untouched window, closer to the present, replays the strategy against the most recent market regime. Forward and live must both be credible: at least one positive, and the pair positive together, or the candidate is discarded.

    recent regimeath ratiocombined test

  6. Stability

    Every parameter is nudged around its chosen value and the strategy is re-run on each neighbour. A strategy that only works on one exact setting is a curve fit, not an edge — we keep the ones sitting on a broad, flat plateau of results.

    neighbourhood scans-scoreplateau, not peak

  7. Permutations

    Monte Carlo permutation testing shuffles the price series itself and re-runs the whole optimization on synthetic data. If the strategy scores as well on noise as it does on the real market, its result was luck, and it never reaches a portfolio.

    in samplein sample + reoptimizedforwardp-score

  8. Selection

    Survivors compete for a seat. Selection balances score against correlation, time in market and symbol concentration, so the portfolio keeps a spread of pairs, timeframes, directions and strategy families rather than a hundred variations of the same trade.

    correlationexposure budgetlong / short balance

  9. Execution

    Selected strategies are promoted to live accounts. A scheduler wakes on every candle close, recomputes the signals from the same code path the backtest used, sizes the position from its risk budget and routes the order to the exchange. Fills, exposure and drawdown stream back to the liveboard.

    BybitBinanceBitgetGate

The engine

Everything under this roof, we wrote.

One TypeScript codebase covers the whole chain, from the first candle downloaded to the last order acknowledged. Here is what lives inside it.

Data279

Indicator library

279 indicators implemented and unit tested against reference libraries — oscillators, moving averages, bands, volatility, volume, candlestick patterns and custom research signals — available in instant, streaming and multi timeframe flavours.

Data2h → 1d

Historical store

Candles from 2017 onward, stored locally and served to the backtester in batches. Higher timeframe series are derived and aligned to the base series, so a strategy can read a daily trend filter while trading a 4h signal without look ahead.

ResearchV2 → V4

Strategy builders

Strategies are declarative objects, not scripts: indicators, signal expressions, filters, presets, exits and risk. Three generations run side by side — classic rule builders and a machine learning builder with KNN classifiers and kernel regression filters.

Research17 vars

Optimizer

A staged optimizer that treats parameters by role rather than as one flat search space, with grid, chunking, Bayesian and stability oriented modes, and a scoring function that rewards consistency rather than the single highest return.

ValidationMonte Carlo

Robustness suite

Permutation tests on synthetic price series, parameter neighbourhood scans, weekly equity and drawdown resampling, all time high ratios, profit factor and Sharpe — the evidence a strategy has to produce before anyone talks about capital.

Execution4

Exchange executers

Native clients for Bybit, Binance, Bitget and Gate on USDT perpetuals, each with a testnet path, one way position mode, symbol filters and reconciliation, so the same strategy can be routed wherever the liquidity and the funding are best.

Ops24 / 7

Schedulers

Two cron driven engines: the research scheduler grinds the optimization and validation queue continuously, while the live scheduler wakes on candle closes to compute signals, place orders and publish state.

AIAgents

Research agents

Language models are used where they are actually good: proposing strategy structures against a strict schema, reading indicator documentation through tools, and turning research notes into testable candidates. Every suggestion is then judged by the same pipeline as any other.

The numbers

The portfolio, measured across three windows.

The current selection holds 134 strategies. Below is how that same portfolio behaves on the data it was fitted on, on the out of sample window that followed, and on the most recent window — the honest three way split every systematic result should be shown with.

In sample

Backtest

→

Profit factor
2.06
Win rate
53.25%
Trades
15 684
Sharpe
0.87
Out of sample

Forward test

→

Profit factor
1.81
Win rate
53.56%
Trades
1 770
Strategies in profit
94%
Most recent

Live window

→

Profit factor
1.13
Win rate
44.88%
Trades
1 123
Strategies trading
89%

Exposure budget

103 long systems and 31 short systems, each carrying a small fixed risk. Position limits are set per symbol so no single pair can dominate the book.

  • XTZ32
  • ADA28
  • BTC22
  • XLM16
  • LTC14
  • BNB14
  • UNI12
  • CAKE10
  • ETH10
  • VET8
  • XRP8
  • AVAX6

Backtest, forward and live window figures are simulated results produced by our own research pipeline over the periods stated, net of fees and slippage assumptions. Simulated results have inherent limitations and are not a reliable indicator of future performance. The curves drawn on the three cards are illustrative shapes, not plotted from trade data. Nothing on this page is investment advice or an offer of any financial product.

The portfolio

One equity curve, every trade since 2017.

The cards above are sketches. This one is not: the 158 strategies of portfolio_ccex1_v1 chained through backtest, forward test and live window, trade by trade. The portfolio page opens it up — window by window, month by month, pair by pair.

portfolio_ccex1_v1 →

+144.03% simulated return on $1,000.00, backtest → forward → live

Per year
+10.26%
Max drawdown
−0.78%
Positive months
65.8%
Strategies
158

Explore the portfolio Equity, drawdown, monthly returns and exposure — all 2 portfolios.

The platform

Two rooms: where strategies are made, and where they trade.

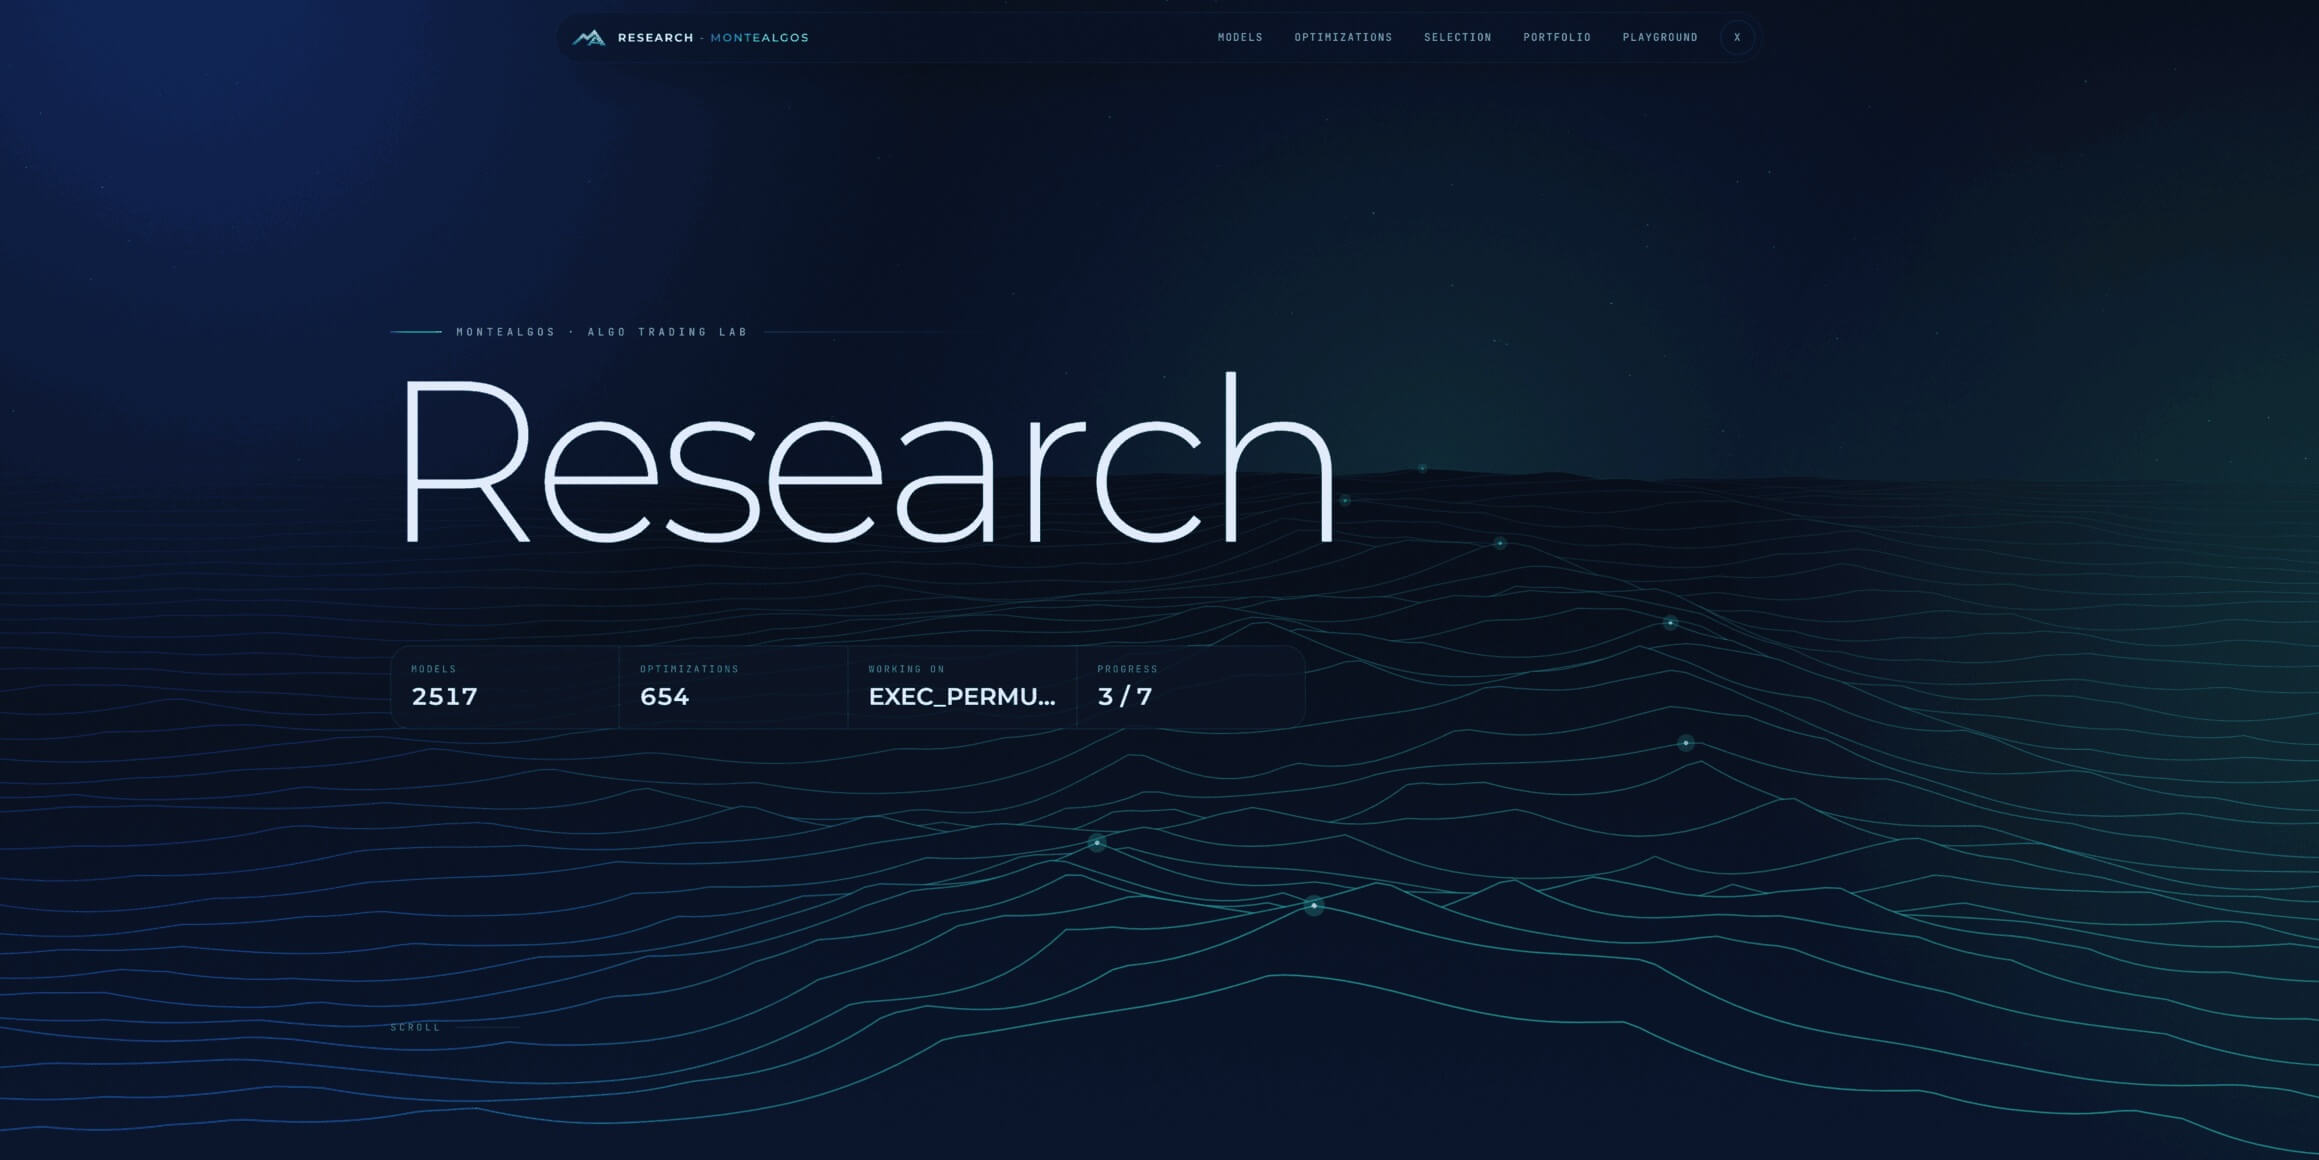
Montealgos research application showing models, optimizations and equity charts

Research

The lab. Thousands of models and optimizations with their full history, equity and drawdown curves for every window, stability and permutation scores, correlation views, selection tooling and portfolio simulation — plus a playground for building and inspecting indicators candle by candle.

  • Models & optimizations
  • Stability & permutation scores
  • Selection & correlation
  • Portfolio simulation
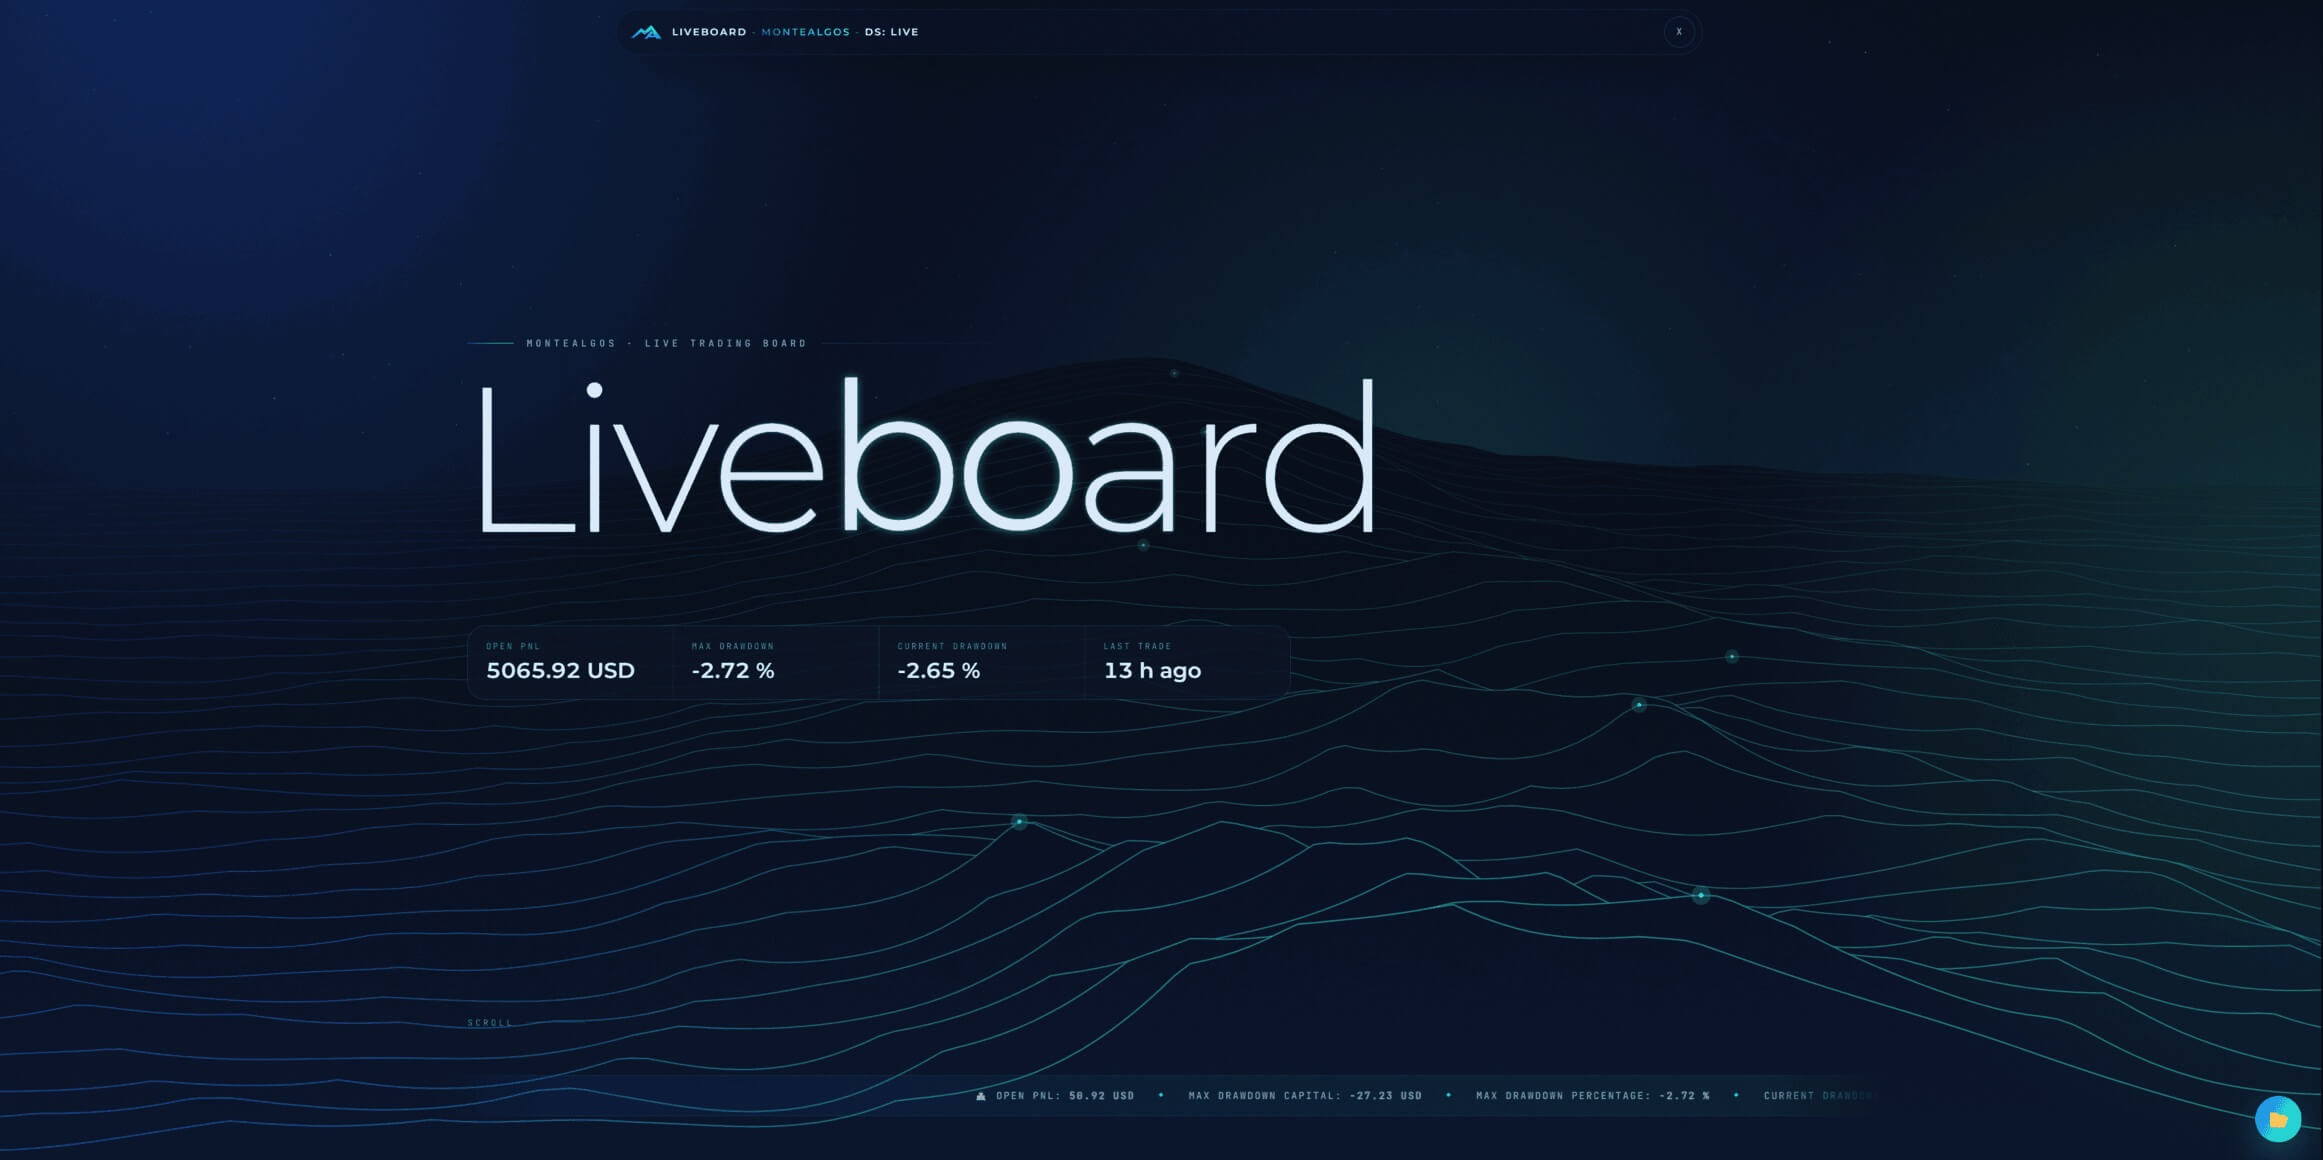
Montealgos liveboard application showing open trades, exposure and system overview

Liveboard

The control room. Open PnL, current and maximum drawdown, live exposure per symbol and direction, open trades, full trade history, per system and per model breakdowns, and an alert feed that reports anything the schedulers could not complete.

  • Open PnL & drawdown
  • Exposure per symbol
  • Trade & system history
  • Health & alerting

Built with

  • TypeScript
  • Node.js
  • Prisma
  • SQLite
  • Express
  • Angular
  • Lightweight Charts
  • Vitest
  • Docker
  • GitHub Actions
  • Vercel AI SDK
  • Web Workers

Contact

Let's talk algos.

Interested in the research, the technology, or a conversation about working together? We answer every serious message.

contact@montealgos.com